Like many of you, I used to work in an office 40-60 hours a week. Then 2020 happened and I didn't go back. I wouldn't mind it really, with ~90% of coworkers opting to stay remote it doesn't make a lot of sense. Maybe that will change in the future, I have no way to predict anything.
When I was at the office I setup a number of system monitoring screens built off Raspberry Pis. I'd strap one to the back of an unused monitor and throw together a quick dashboard.
Here's the thing about monitoring systems - you don't know what you actually need to monitor at first. Of course you can create alerts for errors, or resource usage thresholds, or login failures. And you should start with all of these, that's the minimum. Once a system is live things will happen that you never expected. Some page will run 20% slower for one customer, every Tuesday at 10:13 AM some service will restart, many things will happen that you aren't looking for. I've found having several monitoring boards running to be a good way to catch these things. Especially if you have a short attention span and are strangely more productive when there is background noise.
I didn't expense these Raspberry Pis. I bought them back when Raspberry Pis were available at their sticker price. Recall that this is about pre-2020 life. I figured if I couldn't find a work use for them I'd take them home and do something else. Not returning to the office, that day is now.
I found a use for one of them already, it was converted into what I call "the TurboGrafx-16 mini but better". I'm having a tougher time finding a use for this model 2B with 3.5" screen. Here's a picture of it next to a Super Nintendo cartridge for scale:

I had this running a few different things in the past. The 2B can run Grafana reasonably well, for example. I had a little average response time graph on it once. Unfortunately I can't connect this Pi to work stuff from home because it's a giant hassle involving VPNs and Yubikeys. So I have to dork around with other things I might want to have running in the background.
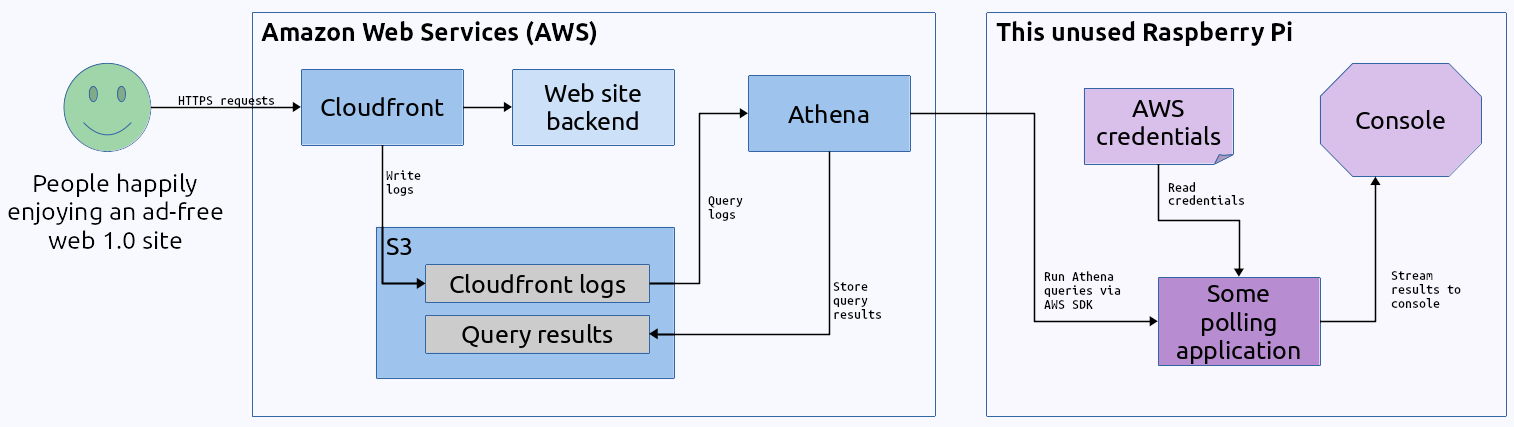
For this demo I am going to connect it to Amazon Web Services (AWS) Cloudfront logs. I'm choosing that on purpose because my day job doesn't use AWS, everything is on a rival cloud platform. This site is all my hobby stuff and won't have anything related to wherever I am working at the time. Also I suspect people will find an AWS thing interesting.
This is mostly a proof-of-concept article. I want to verify I can query Cloudfront logs and display them at all. After getting past that hurdle maybe I'll do something useful.
Here's the high-level design for this:
A quick aside... in a little under a month it will be 10 years since I realized I had to move this site to AWS. In April 2013, I posted something called "If NES Games Were Made Today" that completely wrecked this site. At the time I was hosting this site on Lunarpages, but they are called something else now. Lunarpages, HostGator, GoDaddy, they're all the same. For ~$20* a month they'll host a site with "unlimited" bandwidth. In the fine print you'll see that "unlimited" in fact has an undocumented limit. Whatever that limit was, my gallery of fake NES screenshots radically exceeded it. The folks at Lunarpages shut this site down and another I had with them just for good measure.
Really, it's my fault. I long had the know-how to run this site on AWS and also knew it would be cheaper. Instead of ~$20* a month for highly limited "unlimited" bandwidth, I pay ~$4 a month for effectively unlimited bandwidth. The difference maker is Cloudfront. If something goes as viral as that NES today gallery, Cloudfront handles it completely transparently to me. At worst it costs me an extra $1 that month. There's no comparison. I don't work for Amazon, collect referrals from them, or get any financial anything from them. I will say that, except for maybe some limited use cases, running a basic site on AWS is a vastly better option than a traditional web hosting company.
* = All these web hosts advertise much lower prices but nickel and dime you up to ~$20 a month. Like "Oh, you want to point a domain name to your site? That's $5 a month." and so on.
Cloudfront handles things like scaling and caching in a way that seems almost magical. Its logging is, eh, not so magical. By default it has a web UI where you can see some rolled-up statistics. That's fine but not something I care about. If you care about site usage you probably already know what the best options are. When I look at web logs it's usually to track down a specific problem. For that you need something like Apache or IIS logs.
You can achieve this by having Cloudfront write logs to S3:

I won't go through the instructions, the latest version is hopefully here.
Setting that up gets the raw logs in a place where you can download them. It's much more useful to setup Amazon Athena to query the logs you're now copying to S3. The instructions for that are hopefully still here.
If you do all of this you can now query your Cloudfront logs and visualize them how you see fit.
One warning - Athena charges based on TB of data searched. For your site this might be a lot of data. For the site in this demo, the site you are currently reading, I have the S3 bucket for Cloudfront logs set to retain only one day. This is because I don't care about historical data or site metrics. I have these logs setup so I can look for 404 errors after I post something new or reorganize stuff. I really don't care who visits or how much traffic I get. I care a little about not looking incompetent by having broken links.
Anyway... you probably are keeping more than one day of logs. This means your queries could be combing through a lot of data and costing you real money. You may want to consider partitioning your logs or some of the other suggestions here.
Alright, back to the topic at hand... before we write a program to query these logs we need to create an account with the least access we can get away with. I have a read-only IAM group already:

and also:

I added an ID to that group only to find different permissions were needed to execute queries, even read-only ones. So I granted permissions for that specific account to query the specific table containing my Cloudfront logs:

You also need to create an access key for this user.

Also, this account needs permission to write to an S3 bucket that stores the query results. This of course means creating a new S3 bucket, or folder in an existing one, and granting access. Along the way you probably want a retention policy. Mine is one day, and that's probably the case for you too unless you need to save old query results (I'm sure someone has some reason to). Then you need to make sure the account you created can access the bucket you chose:

With all the permissions setup let's write some code to query the logs. I went with Java because OpenJDK is supported on Raspian and it's what I'm comfortable with. You probably prefer Python and that's cool too.
Here's what I'm thinking - let's write something that queries Cloudfront logs in Athena every, I dunno, 10-30 minutes. We'll then show the results on this little Pi screen. Dumping them all at once will be difficult to read so we'll stagger them. The end result will look like a text ticker. This will work for sites that have less than one thing we're monitoring per millisecond per time interval.
I'll try to explain it better. If we run this every 10 minutes that's 1000*60*10 milliseconds. Or 600,000 if you prefer. If we have 10,000 results we'll display one every 60 milliseconds. If you're trying to watch something that happens more than 100,000 times a minute this idea won't work. I'm using this site as the demo for this idea. Maybe once a year I have something that gets shared and generates gonzo amounts of traffic. Usually, 600,000 hits over an entire day is rare I think. I hope today is a normal day.
And here's the code I came up with to do it all:
/*
 * The license situation for this is a mess.
 * This was originally generated by the AWS Eclipse SDK which tags the code as Apache License.
 * None of it actually worked though so it was rewritten via brute-force trial and error.
 * The resulting code by me (https://HuguesJohnson.com/) is under The MIT License.
 * The SQL query called REQUESTS_QUERY is based on an answer here -
 * https://stackoverflow.com/questions/48389369/aws-athena-cast-cloudfront-log-time-field-to-timestamp
 * It's not used verbatim but probably is technically under this license -
 * https://stackoverflow.com/help/licensing
 * If for some reason you want to use this code just leave these comments in and do whatever you feel like.
 * If you're worried about the StackOverflow license situation just rewrite REQUESTS_QUERY. Everything else is under a non-copyleft license.
 */

package com.huguesjohnson.sandbox;

import java.text.DateFormat;
import java.text.SimpleDateFormat;
import java.util.Calendar;
import java.util.List;
import java.util.TimeZone;

import com.amazonaws.auth.AWSCredentials;
import com.amazonaws.auth.AWSStaticCredentialsProvider;
import com.amazonaws.auth.profile.ProfileCredentialsProvider;
import com.amazonaws.services.athena.AmazonAthena;
import com.amazonaws.services.athena.AmazonAthenaClient;
import com.amazonaws.services.athena.model.Datum;
import com.amazonaws.services.athena.model.GetQueryExecutionRequest;
import com.amazonaws.services.athena.model.GetQueryExecutionResult;
import com.amazonaws.services.athena.model.GetQueryResultsRequest;
import com.amazonaws.services.athena.model.GetQueryResultsResult;
import com.amazonaws.services.athena.model.ResultConfiguration;
import com.amazonaws.services.athena.model.Row;
import com.amazonaws.services.athena.model.StartQueryExecutionRequest;
import com.amazonaws.services.athena.model.StartQueryExecutionResult;

public class LilAthenaPiThing{
  //externalize all these constants into a config file if that makes you happy

  //status messages from GetQueryExecutionResult - not in a public class variable from what I can tell
  private final static String STATUS_SUBMITTED="SUBMITTED";
  private final static String STATUS_RUNNING="RUNNING";
  private final static String STATUS_QUEUED="QUEUED";
  private final static String STATUS_SUCCEEDED="SUCCEEDED";
  private final static String STATUS_FAILED="FAILED";
  private final static String STATUS_CANCELLED="CANCELLED";

  //settings to prevent timeouts or infinite failing loops
  private final static int MAX_QUERY_TIME=30*1000;
  private final static int THREAD_SLEEP=1000;
  private final static int MAX_CONSECUTIVE_ERRORS=5;
  private final static int REFRESH_TIME=10*60*1000;

  //the query to run
  private final static String REQUESTS_QUERY="WITH subq AS
   (SELECT time, uri, status, sc_content_type, referrer, parse_datetime
   ( concat( concat( format_datetime(date, 'yyyy-MM-dd'), '-' ), time ),'yyyy-MM-dd-HH:mm:ss')
   AS datetime FROM cloudfront_logs )
   SELECT time, uri, status, sc_content_type, referrer FROM subq
   WHERE datetime BETWEEN timestamp 'START_TIME' AND timestamp 'END_TIME' order by datetime asc;";

  //where to store the query and other AWS settings
  private final static String BUCKET="s3://YOUR-BUCKET-NAME/";
  private final static String REGION="YOUR-REGION";

  public static void main(String[] args){
    boolean debug=false;
    if((args!=null)&&(args.length>0)){
      for(String arg:args){
        if(arg.toUpperCase().contains("DEBUG")){
          debug=true;
        }
      }
    }

    //used to terminate the main loop if something unrecoverable happens
    boolean fatalError=false;

    //used to build query range
    TimeZone tz=TimeZone.getTimeZone("UTC"); //cloudfront logs are in UTC
    DateFormat dateFormat=new SimpleDateFormat("yyyy-MM-dd HH:mm:ss");
    dateFormat.setTimeZone(tz);
    Calendar calendar=Calendar.getInstance(tz);

    //set initial start time
    calendar.add(Calendar.MILLISECOND,(-1*REFRESH_TIME));
    String startTime=dateFormat.format(calendar.getTime());
    if(debug){ System.out.println(startTime); }

    //setup aws credentials & athena client
    AWSCredentials credentials=null;
    try{
      credentials=new ProfileCredentialsProvider("default").getCredentials();
      System.out.println("Created credentials");
      if(debug){ System.out.println(credentials.toString()); }
    }catch(Exception x){
      x.printStackTrace();
      fatalError=true;
    }

    AmazonAthena athenaClient=null;
    if((credentials!=null)&&(!fatalError)){
      try{
        athenaClient=AmazonAthenaClient.builder()
          .withCredentials(new AWSStaticCredentialsProvider(credentials))
          .withRegion(REGION)
          .build();
        System.out.println("Created AthenaClient");
      }catch(Exception x){
        x.printStackTrace();
        fatalError=true;
      }
    }

    int consecutiveErrors=0;
    while((!fatalError)&&(consecutiveErrors<MAX_CONSECUTIVE_ERRORS)){
      try{
        //set end time
        Calendar now=Calendar.getInstance(tz);
        String endTime=dateFormat.format(now.getTime());
        if(debug){ System.out.println(endTime); }
        //create the query request
        StartQueryExecutionRequest sqer=new StartQueryExecutionRequest();
        String query=REQUESTS_QUERY.replace("START_TIME",startTime).replace("END_TIME",endTime);
        if(debug){ System.out.println(query); }
        sqer.setQueryString(query);
        sqer.setSdkClientExecutionTimeout(MAX_QUERY_TIME);
        ResultConfiguration rc=new ResultConfiguration();
        rc.setOutputLocation(BUCKET);
        sqer.setResultConfiguration(rc);
        //send the query off
        StartQueryExecutionResult sqResult=athenaClient.startQueryExecution(sqer);
        String exid=sqResult.getQueryExecutionId();
        if(debug){ System.out.println(exid); }
        //wait for the query to complete
        int runTime=MAX_QUERY_TIME; //belt and suspenders approach to timeout
        boolean queryRunning=true;
        GetQueryExecutionRequest qexr=new GetQueryExecutionRequest();
        qexr.setQueryExecutionId(exid);
        while((runTime>0)&&queryRunning){
          try{
            //get the status of the query execution
            GetQueryExecutionResult qxResult=athenaClient.getQueryExecution(qexr);
            String state=qxResult.getQueryExecution().getStatus().getState();
            if(state.equals(STATUS_FAILED)||state.equals(STATUS_CANCELLED)){
              System.out.println(qxResult.getQueryExecution().getStatus().getStateChangeReason());
              throw(new Exception("Query failed with status: "+state));
            }else if(state.equals(STATUS_SUBMITTED)||state.equals(STATUS_RUNNING)||state.equals(STATUS_QUEUED)){
              runTime-=THREAD_SLEEP; //good enough place to do this
              if(debug){ System.out.println(state); }
            }else if(state.equals(STATUS_SUCCEEDED)){
              queryRunning=false;
            }else{
              throw(new Exception("Unknown status: "+state));
            }

            //test if query is running
            if(queryRunning){
              Thread.sleep(THREAD_SLEEP);
            }else{ //query completed successfully - show the results
              GetQueryResultsRequest gqrr=new GetQueryResultsRequest();
              gqrr.setQueryExecutionId(exid);
              if(debug){ System.out.println(gqrr.toString()); }
              GetQueryResultsResult gqResult=athenaClient.getQueryResults(gqrr);
              List<Row> rs=gqResult.getResultSet().getRows();
              //first row should be the column names
              int size=rs.size();
              int delay=0;
              if(size<REFRESH_TIME){
                //staggering to create the illusion of a continuous feed
                delay=REFRESH_TIME/size;
              }
              if(size<=1){
                System.out.println("Sorry, no new data this time. Sleeping for "+REFRESH_TIME+"ms.");
                System.out.println("Sleeping for "+REFRESH_TIME+"ms.");
                //not technically an error
                //but if this happens a lot then there's likely something wrong
                //like logs aren't being written for example
                consecutiveErrors++;
                Thread.sleep(REFRESH_TIME);
              }else{
                for(int i=1;i<size;i++){
                  /*
                  * This demo is displaying in a format like:
                  * url
                  * [time][httpstatus][type]
                  * referrer
                  * line break
                  */
                  List<Datum> d=rs.get(i).getData();
                  String time=d.get(0).toString().replace("{VarCharValue: ","[").replace("}","]");
                  String uri=d.get(1).toString().replace("{VarCharValue: ","").replace("}","");
                  if(uri.length()>60){
                    uri=uri.substring(uri.length()-60);
                  }
                  String status=d.get(2).toString().replace("{VarCharValue: ","[").replace("}","]");
                  String sc_content_type=d.get(3).toString().replace("{VarCharValue: ","").replace("}","");
                  if(sc_content_type.length()>42){
                    sc_content_type=sc_content_type.substring(0,40)+"..";
                  }
                  sc_content_type="["+sc_content_type+"]";
                  String referrer=d.get(4).toString().replace("{VarCharValue: ","").replace("}","").replace("https://huguesjohnson.com","");
                  if(referrer.length()>60){
                    referrer=referrer.substring(0,59);
                  }
                  System.out.println(uri);
                  System.out.println(time+status+sc_content_type);
                  System.out.println(referrer+"\n");
                  if(delay>0){
                    Thread.sleep(delay);
                  }
                }
              }
              //reset the error counter
              consecutiveErrors=0;
            }
          }catch(Exception innerLoopEx){
            innerLoopEx.printStackTrace();
            runTime=-1; //break out of the loop
            consecutiveErrors++; //increment consecutive errors
          }
        }
        if(runTime==0){
          System.out.println("Query took longer than "+MAX_QUERY_TIME+"ms to respond");
        }else if(runTime<0){
          System.out.println("Errored out in some other way - see stack trace");
        }
        //increment start time
        startTime=endTime;
      }catch(Exception outerLoopEx){
        outerLoopEx.printStackTrace();
        fatalError=true;
      }//try
    }//while
    System.out.println("Exiting outer loop, something bad must have happened");
  }//main
}
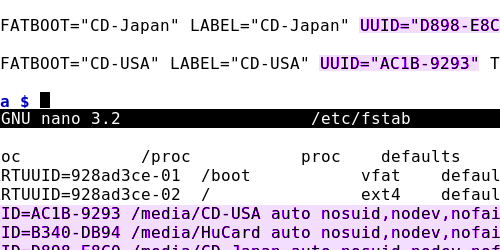
On the Raspberry Pi itself there are a few things you need to do. I used the latest version of Raspbian (which I know isn't called that now) without a desktop. You need to add the AWS credentials to:
/home/[YOUR_ACCOUNT_NAME]/.aws/credentials
The content of that credentials file should be:
[default]
aws_access_key_id = [KEY FOR THE USER YOU CREATED]
aws_secret_access_key = [SECRET KEY FOR THE USER YOU CREATED]
region = [YOUR AWS REGION]
You will also want to set this as an autostart program:
sudo nano /home/[YOUR_ACCOUNT_NAME]/.bashrc
Add a line like this to the end:
java -jar /home/[YOUR_ACCOUNT_NAME]/[YOUR-FILE-NAME].jar
Also you'll want to...
sudo nano /boot/cmdline.txt
Add this to the very end of the line:
logo.nologo
Here it is running, next to a Nintendo desk calendar for scale:

Alright, so I proved this all worked and that's neat. The query I'm running isn't especially useful. I'll probably make it look for error statuses only. I could also take response time stats out of Cloudfront and do another Graphana thing (although I would do that for a real site, not this one).
Tags: Java